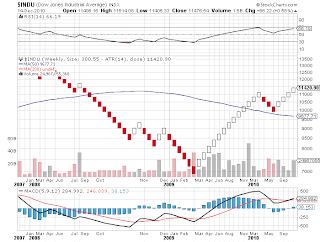
The Inversion Of Rates (10 Year Treasury Bond)
Hold onto your hats, a Tsunami is brewing in the Bond Markets with ominous outcomes for all involved.
Whether you are a Retail Investor, Mutual Fund, Hedge Fund, Bond Trader, Equity Trader while you were
busy listening to the Bulls calling for higher highs the 10yr Bond was creeping up. The above chart is a weekly
chart created with patterns , not candlesticks. The Trading Signals are crisp clear from the top in 2007 to the
bottom in March/2009 and the subsquent rise eventually creating a negative Divergence warning of an imminent
fall and now the most recent rise which will spell the kiss of death to Equities, and the Global Debt Markets.
bottom in March/2009 and the subsquent rise eventually creating a negative Divergence warning of an imminent
fall and now the most recent rise which will spell the kiss of death to Equities, and the Global Debt Markets.

