Ever wonder how the Dow Jones Industrials Index comprised of America's biggest Stocks can affect your life.
Well we all got a taste of that in mid 2007 when the Dow and S&P 500 dropped 50%. I have studied the Dow now for 30 years
and one of my old text books 75 years old sais "There goes GM , There goes the American Economy". Well I'm afraid I'll have to revise that to read " There goes the Dow , There goes the American Economy". Well folks its time again unfortunetely to batten the hatches
because a Tsunami is about to hit the Dow. The current Technical state of the Dow Index itself is almost complete as far as patterns go so now its just a matter of a short time to wait until it turns to the downside. This upcoming leg down will be ONE AND A HALF TIMES BIGGER THAN THE 1ST LEG DOWN FROM THE TOP IN 2007 TO THE MAR/2009 BOTTOM. This is indeed a multi year Bear Market and the green shoots you hear about is all pie in the sky. The |Markets always always precede the Economy, it precedes all the Economic numbers such as Unemployment Claims, GDP,GNP,PPI, Factory Orders. Why is that you might ask.?
Well the Market is the wisdom of millions and millions of some of the brightest minds in the worlds so no Government can outwit or outsmart the Market. So to understand whats going on in the Economy we look at the Technicals of the Markets because its all in the prices as they say, so here goes.
After looking at the technical condition of the Dow and all 30 stocks that comprise the Dow I have drawn the following conclusions.
Completed patternss = 17 stocks....stocks can and will turn to the downside any time.
Near Completed Patterns = 9.....will only take maybe 2-3 months
2 runaway stocks......Exxon Mobil and Procter & Gamble.....Big runaway stocks can prolong an incline or decline.
2 Bear Market stocks.....McDonalds.... which speaks volumes about scarce dollars at the consumer level and Cisco which speaks volumes about the unwillingness of corporations to add IT Hardware and Switches to expand. Onlt other ecplanation is that we are experiencing a real paradigm shift away from Corporations expanding their internal Networks in favour of the "Cloud" in which somebody else takes on responsibility for additional heavy traffic and expansion. Corporations have come to realise this is a cheaper approach and you dont need all those technicians and experts the "Cloud" companies provide that expertise.
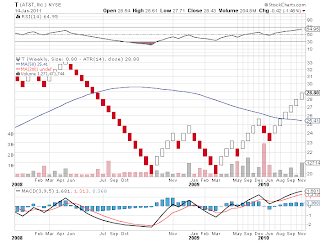
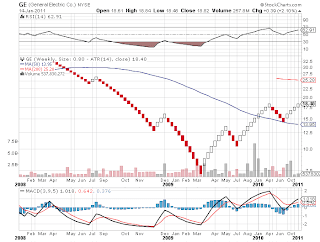
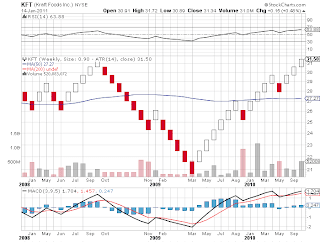
Below you will see charts of the Dow and its Component 30 stocks.
Some Terms to understand:
Negative Divergence.......Price Higher than Last High and Macd (underneath price) lower than last high......Very Scary On A Weekly Chart Using This Methology.
Positive Divergence......Price Lower Than Last Low and Macd Higher Than Last High.......No Such situation exists since we bottomed in Mar/2009.
As you can see almost all patterns are complete and maybe the Market Treads water for the Ultimate Bad News Scenario, but one thing is certain, all the money to be made has been made now its purely defensive strategies from here on in. In you are waiting to make a killing , forget it , because this time you will lose 60-70% from here if you are fully invested in Stocks , so Beware


No comments:
Post a Comment